
The connection pool
DomUI brings its own JDBC connection pool, in the module to.etc.db (package
to.etc.dbpool). It hands out a normal javax.sql.DataSource, so Hibernate,
Flyway and plain JDBC all use it without knowing what it is.
What makes it worth using instead of any other pool is what it does besides
pooling: every connection, statement and result set it hands out is a proxy that
remembers who allocated it, what SQL ran on it and how long that took. That turns
the pool into the thing that tells you a connection was never closed, that a page
fired the same query four hundred times, or which statement and which parameters
produced that SQLException.
- Defining a pool
- The pool file
- Pooled and unpooled connections
- What the proxies add
- Hanging connections
- The monitoring page
- Statistics
- Replaying a database log
Defining a pool
ConnectionPool pool = PoolManager.getInstance().definePool(
	"demo",                                     // the pool id
	"org.hsqldb.jdbcDriver",                    // driver class
	"jdbc:hsqldb:file:/tmp/demoDb",             // url
	"sa", "",                                   // userid, password
	null, null                                  // driver jar, extra properties
);
pool.initialize();

DataSource ds = pool.getPooledDataSource();
That is the whole thing: the demo application's database is set up with exactly
this call, in TestDB in to.etc.domui.derbydata.
A pool goes through two states, and the two calls above are that split:
- Defining it registers the id and its parameters with the
PoolManager. A defined pool already works - you can ask it for connections - but it keeps nothing: every close throws the real connection away. - Initializing it allocates the minimum number of connections up front and switches the pool to pooled mode, where a close returns the connection to the free set instead of dropping it.
Defining the same id twice is allowed as long as the parameters are identical; the second call returns the pool that already exists. Defining it with different parameters is an error, which is how two pieces of startup code disagreeing about the database get caught.
The pool file
Connection parameters do not belong in code, so the normal way to define a pool is to name it and let the pool manager read the rest from a file:
ConnectionPool pool = PoolManager.getInstance()
	.initializePool(new File("/etc/myapp/pools.properties"), "demo");
In a properties file every key is <poolid>.<parameter>, so one file holds as
many pools as you like:
demo.driver=org.postgresql.Driver
demo.url=jdbc:postgresql://localhost:5432/demo
demo.userid=someuser
demo.password=somepassword
demo.minconn=5
demo.maxconn=20
The same pool written as XML, in a file ending in .xml, is a pool element per
pool with the parameters as attributes:
<pools>
	<pool name="demo"
		driver="org.postgresql.Driver"
		url="jdbc:postgresql://localhost:5432/demo"
		userid="someuser" password="somepassword"
		minconn="5" maxconn="20"/>
</pools>
definePool(id) and initializePool(id) without a file look for
~/.dbpool.xml and then ~/.dbpool.properties in the user's home directory,
and fail if neither exists. That is the developer-workstation form: the pool
names live in the code, the credentials live in one file per machine that is
never committed.
Whichever file is used, a file with the same name plus .local next to it wins
for every parameter it defines. pools.properties.local is where a developer
points demo at their own database without touching the committed file.
Parameters
| Parameter | Default | What it does |
|---|---|---|
url |
- | JDBC url. Required. |
driver |
- | Driver class name. Required. |
userid, password |
- | Credentials; userid is required. |
driverpath |
- | A jar to load the driver from when it is not on the classpath. A relative path is resolved against the home directory. |
minconn |
5 | Connections allocated by initialize(). |
maxconn |
20 | Connections handed out before allocation blocks. Raised to minconn + 5 when it is below minconn. |
check |
false | Run a statement on a connection before handing it out, and discard it when that fails. |
checksql |
per database | The statement check runs. Defaults to select 1 from dual on Oracle and select 1 on PostgreSQL and MySQL; on any other database check without a checksql is an error. |
scan |
enabled |
Hanging connection handling: enabled, warn or disabled - see below. |
statistics |
false | Collect per-statement statistics. |
logstatements |
false | Print every statement to stdout. |
logallocation |
false | Print every connection allocation and close to stdout. |
logallocationstack |
false | Print a stack trace with each of those. |
logrslocations |
false | Record the allocation point of every result set. Defaults to true in warn scan mode. |
ignoreunclosed |
false | Do not report resources the connection had to close itself. |
printexceptions |
false | Print SQL exceptions as they happen. |
binaryLog |
- | File to write the binary statement log to. |
sqltrace |
false | Oracle: alter session set sql_trace=true on every connection. |
Anything else the driver needs is passed through: a key demo.p.ssl=true (or
demo.extra.ssl=true, or a p-ssl="true" attribute in XML) reaches the driver
as the connection property ssl.
Pooled and unpooled connections
A pool hands out two kinds of DataSource, and the difference is not whether
connections are pooled - both come from the same set - but what the pool expects
of them:
DataSource pooled = pool.getPooledDataSource();
DataSource unpooled = pool.getUnpooledDataSource();
Pooled connections are for request handling. They are counted against
maxconn, and they are expected to be closed quickly; the janitor described
below will take one away that is not.
Unpooled connections are for the code that legitimately holds a connection
for minutes: batch jobs, imports, a schema migration at startup. They are not
counted against maxconn, so there is no limit on how many exist, and the
janitor never closes one. This is why DbUtil runs the Flyway migration on
getUnpooledDataSource() and only gives Hibernate the pooled one.
"Unpooled" is a bad name for it - the connections are pooled. Read it as "not subject to the pooled-connection rules".
What the proxies add
Everything the pool returns is a wrapper: ConnectionProxy for the connection,
and statement and result set proxies for what is created from it. Three things
come out of that.
Resources are closed with the connection. Every statement and result set is
registered with the connection that made it. Closing the connection closes all
of them, so a forgotten ResultSet cannot keep a cursor open on a connection
that is already back in the pool and being used by someone else. What it had to
close is reported, unless ignoreunclosed says otherwise.
Exceptions carry the statement. A failing statement is not reported as the
driver's bare SQLException; the pool wraps it in a BetterSQLException whose
message contains the SQL that failed and the parameter values that were bound to
it, with the original exception as the cause and its getErrorCode() and
getSQLState() passed through. The stack trace tells you what broke and what
it was running.
Everything is timed. Each statement's execution time is measured, which is what the statistics below are built from.
Hanging connections
The PoolManager runs a janitor thread that scans every pool every minute for
connections that are still allocated. What it does with them is the scan
parameter:
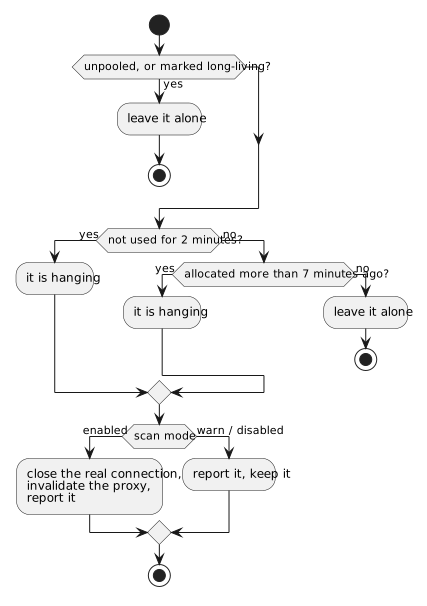
enabled, the default, is the production setting: a connection nobody closed is taken away, and the code still holding the proxy gets an exception the next time it uses it. The report on stdout names the allocation point, so you know which code leaked it.warnreports the same thing but destroys nothing, and turnslogrslocationson so the report can say where each result set came from. It is the development setting: you get told about the leak but the run continues.disabledscans nothing.
disabled is not absolute. When a pool runs out of connections it retries for a
minute, and if it is still empty it runs the scan itself in forced mode
regardless of the setting - closing anything unused for two minutes - before
giving up with pool is exhausted. Before that it panics through the pool
manager's message listeners, with a dump of every used connection and where it
was allocated.
A connection that is meant to be held for a long time is exempted explicitly:
PoolManager.setLongLiving(connection);
The monitoring page
to.etc.db ships a single JSP, pool.jsp, that shows every pool defined in the
running application. Drop it in the webapp and it works - there is nothing to
configure. It is live in the demo application:
The overview is one row per pool: connections in use and peak use for pooled and unpooled separately, how many connections are allocated against how many are allowed, how many allocations were served from the pool versus opened against the database, and the counts that mean trouble - waits, failures and hanging connections. Behind the links are the list of currently used connections with the stack trace of the code that allocated each one, the saved errors, and the statistics below.
The page also acts: it can switch allocation stack traces and error saving on and off for a pool, and force the hanging-connection scan to run now.
Those actions are why pool.jsp is not something to leave open to the world.
It is a diagnostic page, not a status page - put it behind whatever protects
the rest of your application's administrative screens.
Statistics
With statistics=true on the pool, every statement's SQL, parameters and
execution time are collected. To attribute them to the request that caused them,
register the pool's request listener in web.xml:
<listener>
	<listener-class>to.etc.dbpool.StatisticsRequestListener</listener-class>
</listener>
From then on pool.jsp can show, per request url, how many statements it ran and
how long they took, and the totals over all requests since the counters were
cleared - which is how a page doing one query per row in a loop is found. Turning
on session statistics from the page keeps the last fifty requests of your own
session with the full statement list of each, so you can look at one page's SQL
rather than at an average.
Session statistics keep every statement of every request in memory. The page says so when you enable it: switch it off again when you have what you need.
Replaying a database log
Setting binaryLog writes every statement the pool executes to a file, with its
timing. to.etc.dbreplay.DbReplay plays such a file back against a database:
$ java to.etc.dbreplay.DbReplay -pf ~/.dbpool.properties dblog.bin target
By default it replays with the original time gaps between statements, so the
target database gets the same load in the same shape as the system that recorded
it. -maxwait caps the gaps, and -speedy with -perwait replays at a chosen
rate instead - a recorded morning's work becomes a load test. -dump prints the
file instead of running it.
This is a load and regression tool for a real workload: record on the system that is slow, replay against the one you changed.